Agronomy Update
Jun 23, 2025
Agronomy CSI: Cracking the Case of Yellow Oats
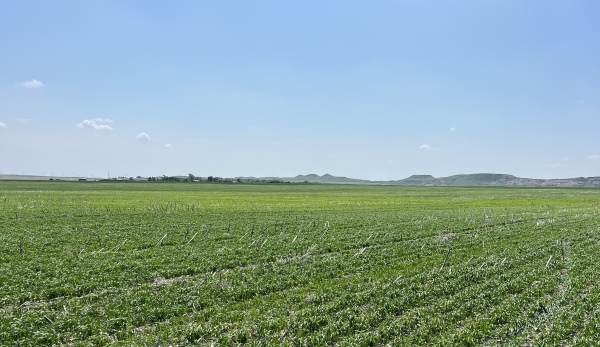
Once you're past the rush of in-crop herbicide spraying, you might find yourself revisiting certain fields—especially those with yellow or off- colored patches—wondering what went wrong. That’s a great time to grab your soil probe and scissors and do some Agronomy CSI.Here’s a case study from an oats field showing yellow patches.
Below is the process I follow to understand the cause and whether anything could be done to fix it.
Step 1: Rule Out Bugs and Disease
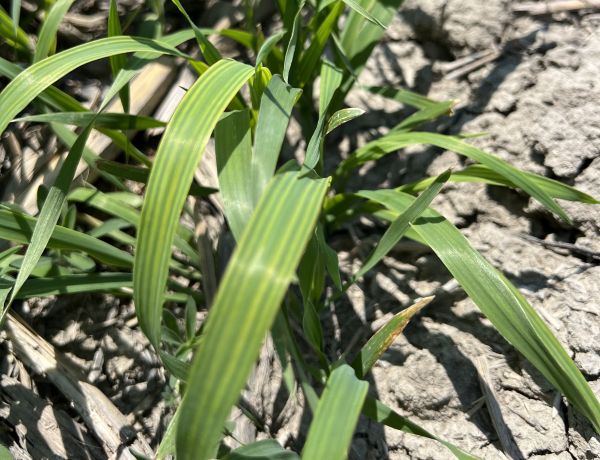
The first thing I wanted to eliminate was the possibility of disease or insect pressure. After careful scouting, no insects or diseases were found. What I did find was a textbook case of nutrient deficiency.The most telling sign? Interveinal chlorosis on the newest leaves, dark green veins with yellowing between them, while older leaves remained a healthy green (picture below). This is a key clue in identifying which nutrients might be lacking.
Some nutrients are mobile in plants, meaning they can be moved from old tissue to new growth to meet the demands of a growing plant. Others are immobile and can't move once deposited. So, deficiency symptoms show up according to the mobility of the nutrient:
- Mobile nutrients (e.g., nitrogen, phosphorus, potassium) show up in older leaves.
- Immobile nutrients (e.g., sulfur, zinc, iron) show up in newer growth.
Step 2: Soil and Tissue Testing
To dig deeper, I took soil and tissue samples from the yellow “sick” spot, and a nearby green “healthy” area.This comparison is critical. If you only test the affected zone, you might miss the full story, as sufficiency ranges can be broad. Having a refer- ence from healthy crop helps highlight real differences.
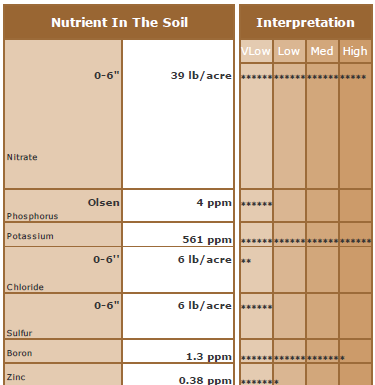
Soil Results:
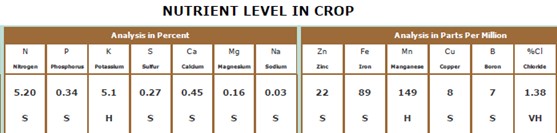
Yellow Area: Very low phosphorus and sulfur. Zinc also low.
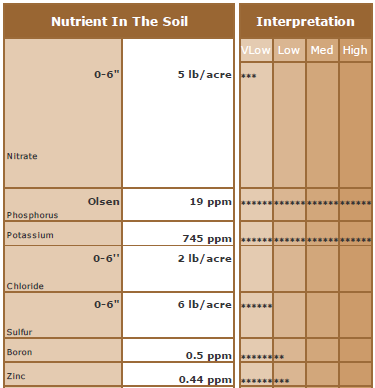
Green Area: High phosphorus. Sulfur and zinc still low, but better than the yellow area.
Tissue Results:
Yellow Area: Low phosphorus and zinc (not deficient by lab standards), but sulfur levels were sufficient.
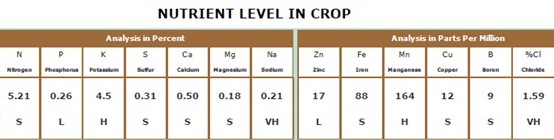
D = Deficient, L = Low, S = Sufficient, H = High, V = Very High
Green Area: All nutrient levels within sufficiency range.
Step 3: Diagnosing the Deficiency
Comparing across all samples, phosphorus and zinc looked like the main suspects. However, the symptomology on new growth points more strongly to zinc, an immobile nutrient. Phosphorus deficiency would show in the older leaves first.Step 4: The Twist in the Plot
We applied zinc, but saw no visual improvement.That’s when I re-examined the data and noticed something we’d initially overlooked: elevated sodium levels in the yellow spots.
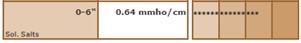
Further investigation revealed that these zones sit on a shallow clay- pan, leading to poor drainage and sodicity issues. Sodium builds up because water (and nutrients) can't leach properly, and excessive sodium can harm root function and crop growth.
The Takeaway
Yes, zinc deficiency was part of the issue, but the underlying problem was high sodium levels and an underlying claypan layer.These “sick” spots were less than one acre in size and located in low, poorly drained depressions. While they may be small patches, managing many of them across the farm adds up to a stronger return on investment.
Using yield maps, zone maps, and precision soil sampling, we identified these as areas with consistently low productivity. Rather than spending money applying extra zinc, we now manage these zones as low-input areas, utilizing variable-rate technology to stretch fertilizer dollars further.
Its worth the time and effort to do some sleuthing on your farm to identify these problem areas, get a diagnosis and manage them accordingly. Be prepared for it to take some experimenting to figure out the real culprit. If you need help just reach out to your Horizon Resources Agronomist.
Kyle Okke, CCA
Agile Agronomy LLC & Agronomists Happy Hour Podcast
Head Scab Fungicide Timing and Current Risk Forecast
The early planted durum, wheat and barley is usually ready for a head scab fungicide application right around the 4th of July weekend in our area, so the time to start planning your head scab application is now.
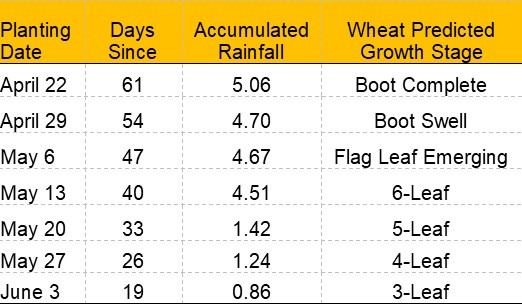
NDAWN Growing Degree Day model results on 6/23. Rainfall based on the Pioneer weather station.
It is absolutely critical to get the timing right to maximize head scab control, and minimize vomitoxin (VOM) contamination. The proper timing for a fungicide application for head scab in wheat or durum is when at least 50% of the main tiller heads are flowering (yellow anthers) and then up to a week after that stage. There is an advantage to waiting that week if you can, as additional heads will begin to flower.
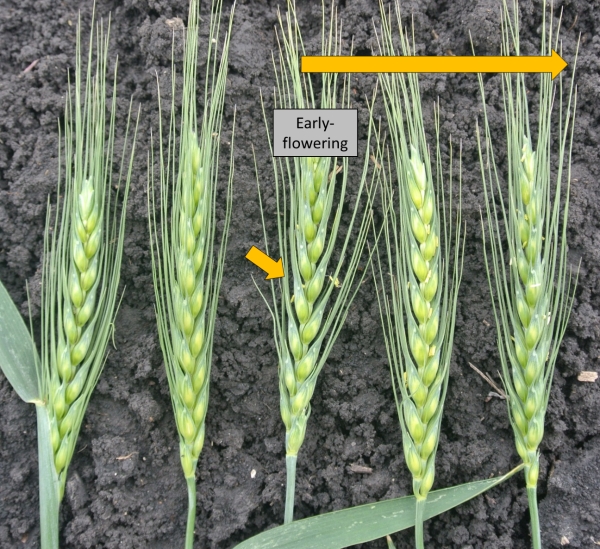
Wheat head scab fungicide timing. Dr. Andrew Friskop, NDSU
In barley the recommended timing for a scab application is when the heads on 50% of your main tillers have just fully emerged from boot, or up to a week after that. Notice the flag leaf is just below the head at the start of the application window (picture below). If you spray when most of the heads are still in boot then you won’t get the fungicide on the head, which is where the pathogen infects. Research from NDSU scientists showed that actually that later timing (one week post heading) is better than the heading timing. In that study, Miravis Ace applied at half head emergence only provided 5% VOM suppression, compared to 48% and 70% at the full head and one week post full head timing. So in this case it really is better to be late than early!
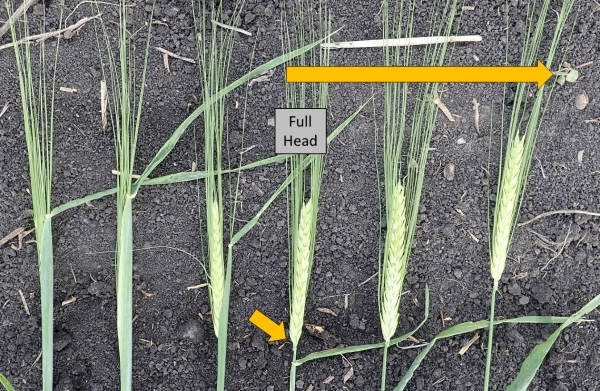
Barley head scab fungicide timing. Dr. Andrew Friskop, NDSU
The most effective products for head scab are Miravis Ace, Prosaro, Prosaro Pro, and Sphaerex. Applied at the correct timing you can expect 45-60% suppression. Unfortunately under significant disease pressure none of these products can provide complete control. An inferior head scab fungicide like tebuconazole (Folicur and generics), will only provide 20-25% suppression. Unlike Folicur, the most effective products for head scab are also very good to excellent on tan spot and other foliar fungal leaf spot diseases which may have spread to the flag leaf. Folicur is primarily for control of rusts, which we really don’t see very often in NW ND. High levels of disease on the flag leaf will cost yield, so protection of the flag leaf is a significant advantage. You do not want to spray a premix product which contains a QoI (Group 11) fungicide at the head scab timing as this group may actually increase VOM.
Right now risk in our area is low to moderate depending on the model you follow. The top picture below is a risk map from the NDSU Small Grains Disease Forecasting model and the bottom picture is the National model hosted by Penn State both from today. The maps show risk for very susceptible wheat varieties, which I would consider durum in general to fall into that category. Risk is less for moderately resistant varieties of HRSW.
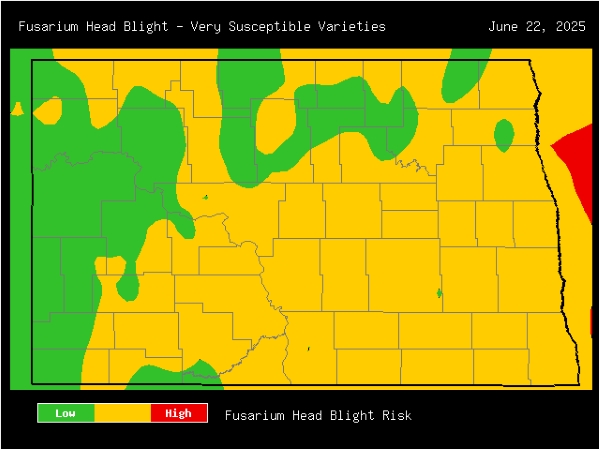
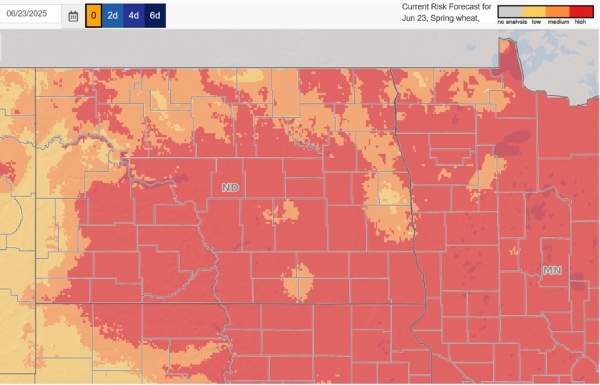
You’ll notice that the two models produce very different risk maps, with the National model showing higher levels of scab risk across the state. I’m concerned that this discrepancy may be due to the highly localized rain events we’ve experienced recently. Since the NDSU model relies on data from NDAWN stations, it may not accurately represent scab risk across broader areas where conditions differ.
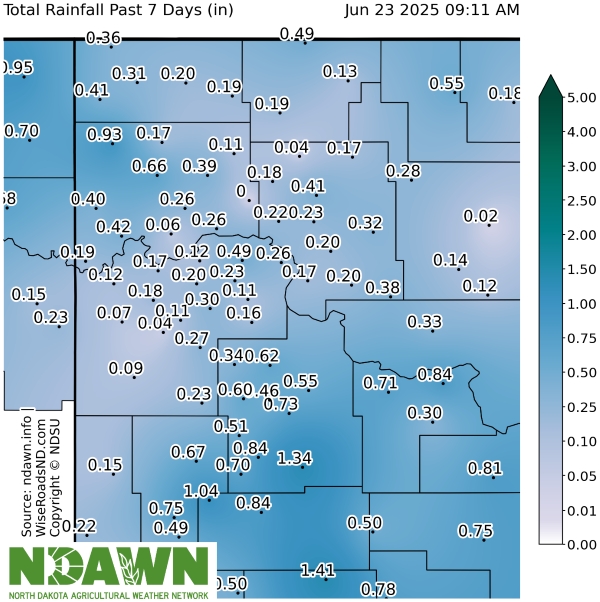
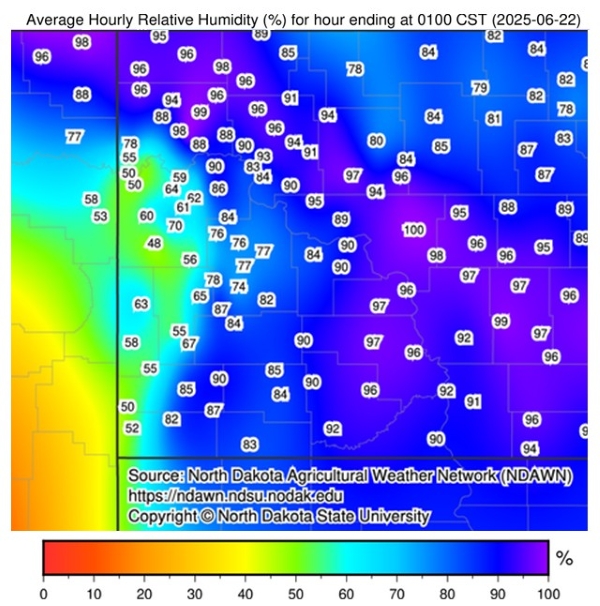
Both models use relative humidity as a key input for risk prediction, which is heavily influenced by rainfall. Below are maps showing rainfall and relative humidity from NDAWN stations in western North Dakota. The humidity map reflects data from June 22nd at 1:00 AM, and you can clearly see the variability. Typically, humidity peaks overnight — yesterday, we saw 11 hours above 90% humidity, and the day before, 9 hours above 90%. If this wet weather pattern continues, I would expect scab risk to increase.
As I mentioned in last week’s newsletter, none of us has a crystal ball when it comes to disease pressure. To support your fungicide application decisions, use both scab prediction models and scout fields for foliar disease symptoms, especially on the flag leaf. Recent conditions have been favorable for the development of foliar fungal leaf spot diseases, and yield loss can occur if the flag leaf becomes heavily infected.
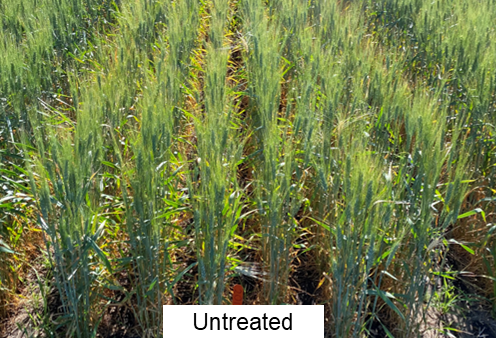
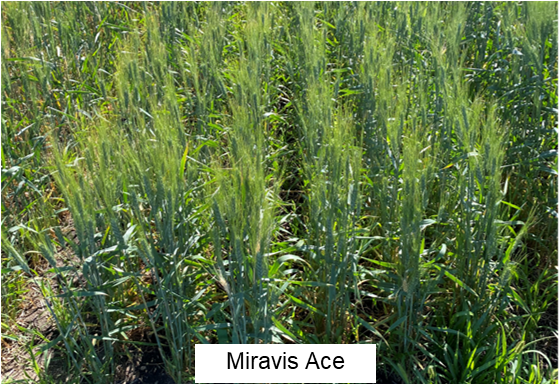
Below are photos from a 2020 durum scab trial I conducted, comparing an untreated plot with one treated with Miravis Ace at the flowering stage. You can see how much healthier the leaves are where the fungicide was applied.
If you have any questions about the management of head scab or other foliar diseases don’t hesitate to reach out.
Dr. Audrey Kalil
Agronomist/Outreach Coordinator
The Real Cost (and Value) of Weed Control
Right now, farmers are spending a lot of money on weed control, and I want our customers to feel confident in that investment. It is essential to stay on top of weed control for several reasons: preventing resistance to the products we have that still work, limiting the amount of seed in the soil seedbank, and maximizing our yields by reducing weed competition.
I constantly talk about preventing herbicide resistance and people probably get tired of hearing me stress this, but it is happening. If you think you and your farm will be immune to resistance, you are badly mistaken. This is occurring with all our herbicides and multiple weed species. For some modes of action, there is no warning that they might not work as well as they did in the past, they just stop working. When that happens, it doesn’t matter what rate of product you use or if you increase the water volume. You can spray 10 times the recommended rate and 30 gallons of water per acre, and it just doesn't matter at this point. You can probably spray straight product on the weeds, and it still wouldn’t be effective.
There is no fixing resistance. The seeds that were produced by the weeds that escaped are even more tolerant than the weeds you missed before. At this point, it is game over with this herbicide and you will need to change products, and it could even impact what crops you are able to grow.
Some of the weeds we’re battling in Western North Dakota and Eastern Montana are extremely prolific seed producers, and many can significantly reduce yields. We are always fighting kochia and Russian thistle, which can produce 15,000 to 25,000 seeds per plant. They’re also highly effective at spreading, as they blow and tumble across fields. These seeds only stay viable in the soil for a few years, maybe up to five, but our winds can carry them for miles, meaning you can end up with weeds in your field even if they weren’t there before. When not controlled in your crops, densities of 15 to 20 weeds per square yard can reduce yield by 25% to 50%, depending on soil moisture. These weeds seem to thrive in drought conditions. In other parts of the state, Palmer amaranth has been found. We really don’t want it showing up here—it can produce up to 500,000 seeds per plant, and resistance to several herbicides has already been confirmed in other regions.
Perennial weeds are especially concerning. It doesn’t take many plants per yard to impact yield, their seeds stay viable for 20 to 50 years, and once they are established most of the plant biomass is below ground so it becomes a several year project to control. Bindweed only produces about 500 seeds per plant. The real problem is the 15 to 20 feet of roots below ground. Canada thistle produces 1,500 seeds per plant and that seed can stay viable for 20 years. Once established, 90% of the root mass will be between 2 to 6 feet below the surface. Only 10% of the root mass will be in the top foot, and cultivation actually stimulates root growth. Fewer than 10 plants per square yard can reduce yield by up to 25%, in addition to requiring multiple years to bring under control.
Grassy weeds typically don’t produce as many seeds as broadleaf weeds, but they can still severely impact yield. Cheatgrass only produces about 500 seeds per plant and lasts only about 3 years in the soil, but can reduce yield by up to 60%. Wild oats only produces about 200 seeds per plant, but these can persist for 30 years, and just 10 plants per square yard can reduce yield by 10%. Green foxtail produces about 1,000 seeds, lasting around 5 years in the soil. You’d need more than 100 plants per square yard to reduce yield by 10%. While that might not seem like a lot, 10% yield loss can cost more than your entire spray program—so don’t walk away from what you may perceive as small yield reductions.
Commodity prices are a bigger concern today, with sub-$6 wheat and $7 durum, but the amount we spend per acre on weed control is about the same as it was 25 years ago. Just the products have changed. In the late 1990’s we were using a lot of granular herbicides to control grasses like wild oats and foxtails. To kill both grasses, we were using about 12.5 lbs of Buckle herbicide at $1.15 per pound for a total of about $14.50 per acre. For broadleaf weeds, we were using a lot of Banvel products plus 2,4-D’s and long residual SU products like Amber or Ally. They were all treatments that cost $5 to $7 per acre and when you added a fungicide into your herbicide you had close to $25 per acre in your total post applied wheat application. We are spending the same $25 per acre today that we spent 25 to 30 years ago, only we are spraying more as a total dollar amount on your farm because we have very little summer fallow.
During times of low commodity prices, many growers consider switching to low-cost generic herbicides or dealers focused solely on price. The math often doesn’t support that strategy, even if you set aside the long-term cost of failing to control weeds. Assuming you can save 20% by purchasing products basically at cost compared to retailers’ normal pricing, you would only save $5 per acre on a $25 per acre treatment. On a 40-bushel yield, that equates to $0.125 per bush- el in your cost of production. This will not replace $10/bushel durum.
Our goal is to help you achieve the best weed control possible, so we have invested in qualified staff who can determine the weed species and provide product recommendations based on that. We also subscribe to a record keeping program so growers can better plan their crop rotation around a weed management strategy. Farmers are paying $10 per acre for these services in other parts of the state which equates to $0.25 per bushel in your cost of production. On top of that, last year we returned 12.66% in patronage on products, or over $3 per acre on that $25 per acre investment. By working with your local Co-op, you are getting a $10/ac services for free plus $3 per acre back.
Effective weed control is not just about minimizing costs this season— it's a long-term investment in maintaining yield, managing herbicide resistance, and protecting your farm’s productivity. Herbicide resistance, seedbank buildup, and reduced yields all have long-lasting consequences. Choosing quality products, working with knowledgeable advisors, and keeping solid records of applications and crop rota- tions will pay off far more than short-term cost savings.
If you have questions or want to review your current program, don’t hesitate to reach out. We’re here to help you protect your farm and maximize returns—not just this year, but for many seasons to come.
John Salvevold, CCA
Agronomy Division Manager