Agronomy Update
Dec 15, 2025
2025 Dryland Soil Test Summary
Fall soil testing is essential to making appropriate fertility decisions for the following growing season. It can also help guide application rates for herbicides which behave differently in soils based on pH and organic matter. We have received soil test results back from 152 dryland fields that were conventionally sampled this fall. When fields are sampled conventionally, we combine multiple soil samples across the field trying to target areas that reflect the average performance rather than the highest and lowest performing areas. Below we summarize what we found for organic matter (OM), pH, nitrogen (N), phosphorous (P), and chloride (Cl). If you want to compare our results to statewide and regional trends, visit the Agvise website for 2025 soil test summaries.Organic Matter
Soil organic matter (OM) is an important indicator of soil health and plays a number of roles in the functionality of soil for crop production. It is made up of the living or formerly living components of the soil in various stages of decomposition. Fresh crop residue and living organisms including soil microbes contribute to the soil OM as well as humus, which is fully decomposed plant and animal residue.As organic matter breaks down, it releases nutrients like nitrogen, sulfur and phosphorous. Crops grown in low organic matter soils are therefore more reliant upon fertilizer for crop productivity. Organic matter also functions like a sponge, hanging onto rainfall for longer and making cropping systems more resilient to drought stress. Through its gluelike properties and nutritional support of soil microbial communities, organic matter promotes soil aggregation. Increased aggregation gives soil a porous structure leading to less crusting and improved water infiltration. Areas of fields where water ponds and fails to move down into the soil profile may be due to poor soil structure.
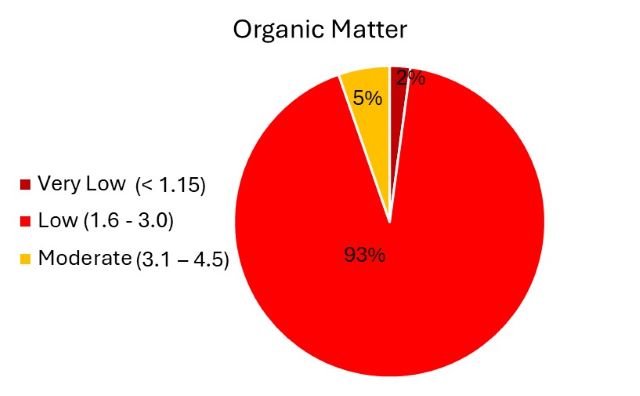
Over time, we have lost organic matter in fields through tillage, erosion and crop rotations, where insufficient carbon is being returned to the soil. The graph above shows the percent of fields tested which fell into the different OM categories according to Agvise classifications. The majority of the fields we tested (88%) fell into the “low” category with 1.6 to 3.0 percent OM, with an overall average of 2.5%. A few fields (11%) fell into the “moderate” category with 3.1 to 4% OM and 1% fell into the “very low” category with 1.5% OM or less.
Given the role organic matter plays in holding onto the limited moisture we receive, it may be worthwhile to consider options for building organic matter in fields where levels are low and declining. Organic matter accumulates in soils which are covered by vegetation and not disturbed, similar to our native prairies. While that is not always possible in agricultural production, reduced till or no till systems have played a huge role in preserving organic matter. Growing high residue crops, perennial crops, or cover crops and leaving crop residue in the field are all ways that we can increase organic matter in fields that are already in no-till systems. While it is good to monitor organic matter levels if you are actively trying to improve soil health, be wary of reading too much into changes in organic matter on soil tests from year to year. Building soil organic matter is a slow process and a small swing from year to year could just be due to differences in sampling.
pH
The pH is a scale which indicates the concentration of hydrogen ions in the soil. The optimal pH for the growth of most crops is between 6 and 7, and this is due to the availability of crop nutrients and the activity of soil microbes. Rhizobia and other bacteria can be negatively impacted below a soil pH of 6, and thus microbial process such as nutrient mineralization and nitrogen fixation can be reduced. Nutrient availability also changes with soil pH, where most of the nutrients needed for crop growth (N, P, K, S, Ca, Mg) are less available when soil pH falls below 5.5. Aluminum is actually more available under acidic soil conditions and this can result in toxicity when the pH is less than 5.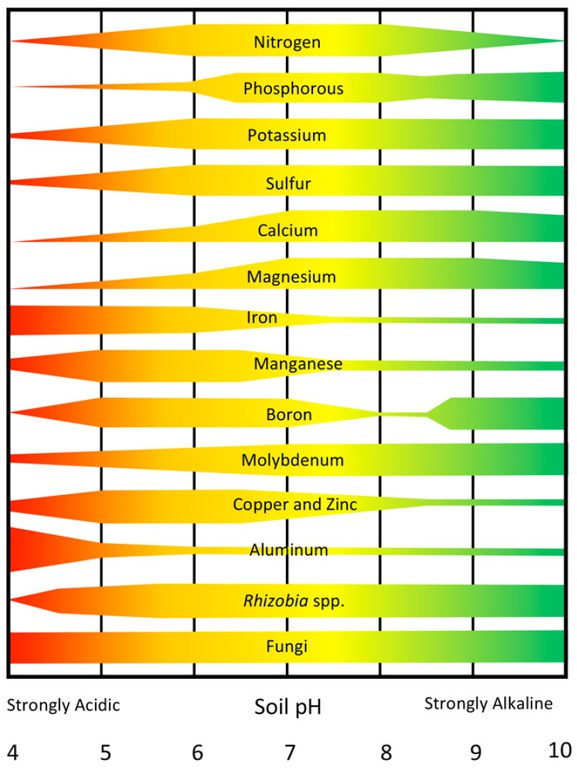
Soils in our area have historically been basic (7.5 to 8.4), but fertilization has decreased the soil pH over time, particularly in the top 0 to 3 inches. Based on a 0-6 inch soil sample, 28% of the fields we tested had a high pH (7.5 to 8.5), 55% of fields were in the medium range (6.6 to 7.5) and 18% of fields were in the low range (5.6 to 6.5). As these soil samples are a composite of multiple soil cores, it is possible that there are areas within the field that are more acidic.
Fields with a pH below 6 could see issues with nutrient deficiency. Herbicide persistence and activity will also be affected by soil pH, so if you don’t normally test your soils it might be a good idea to double check and understand how weed control or crop response could be impacted.

Nitrogen
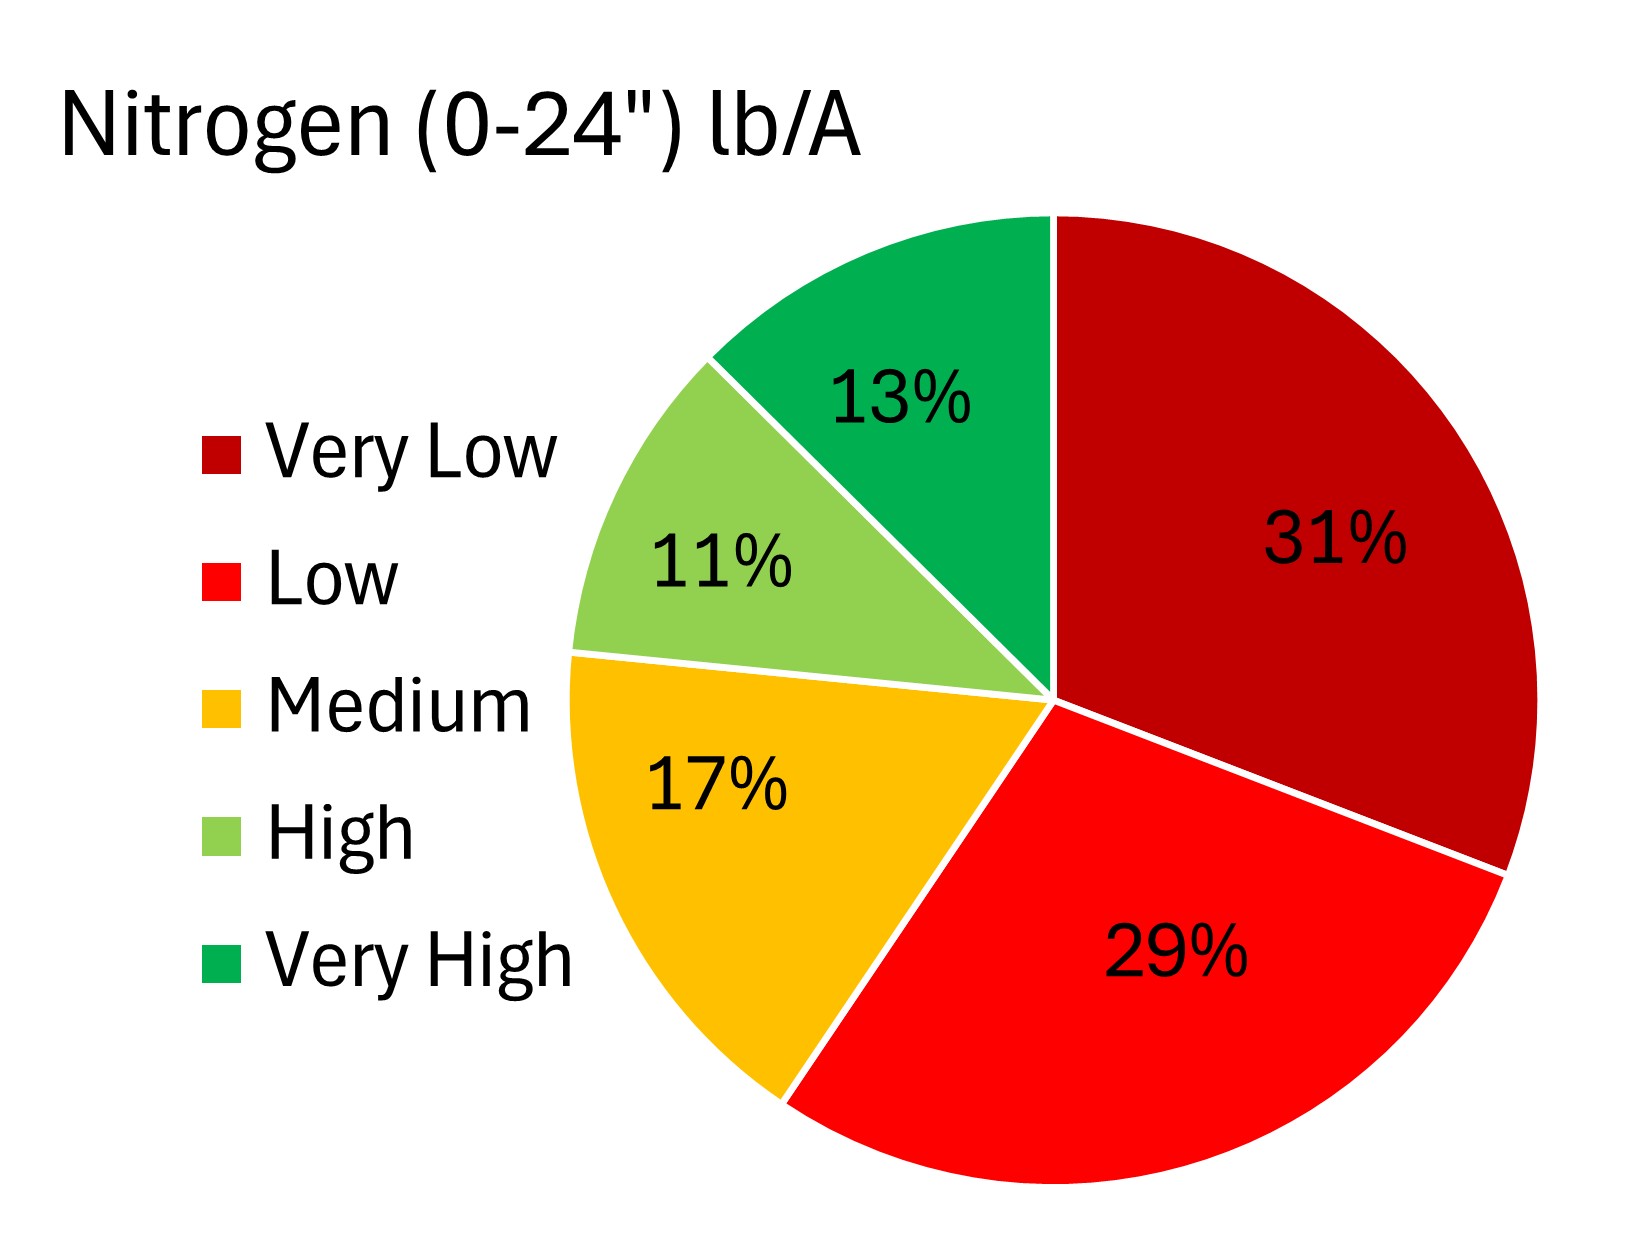
Nitrogen is highly mobile in the environment, and so it is the most important to monitor on an annual basis. With the moisture we received late summer and into the fall, mineralization of nitrogen likely occurred, contributing to higher soil nitrate in fall soil tests. In 49% of the fields we tested nitrate levels were below 20 lb./A which is considered “very low,” 40% were in the low category (21 to 40 lb./ac) , 9% were in the moderate category (41 to 60 lb./ac) and 2% of fields fell into the high category (>80%). These numbers are slightly higher than what we saw last fall. There were still many fields that had low soil N tests and if your soil test fell below 10 lb./A it is possible that your crop ran out and it was a limiting yield or quality factor for you in 2025.Applying the same amount year after year, neglects the role of the environment in the movement of this nutrient both before and after you plant. Soil testing in the fall, and then monitoring for signs of deficiency in the early spring will help you dial in this vital nutrient.

Phosphorous
Next up on our macronutrients is phosphorous which, due to its immobility in the soil, is a nutrient we can actually bank from year to year. Phosphorous is essential to plant growth as the major component of DNA and ATP, the form of energy plant cells use to fuel reactions including photosynthesis. An adequate supply of phosphorus is needed for proper root development, flowering, seed production and nitrogen fixation in legumes. In 24% of the fields we tested phosphorous levels were high, or very high, while 76% weremoderate, low or very low. The 42% of fields that were low or very low are particularly concerning, as that indicates the soil is being mined aggressively for phosphorous. These numbers are fairly consistent with what we saw last fall.

Some phosphorous should always be applied when growing crops like wheat, durum and canola. This is because of the “starter” effect, which can be observed even when soil test level of phosphorous are high. Phosphorous doesn’t move in the soil like nitrogen does so placement in the rooting zone is important. In chickpea too, starter can increase seed size and pod height. Pea and lentil are less responsive when soil tests are very high. Soil testing before peas or lentils is therefore of particular importance. If you are considering skipping the starter on those crops, you may limit yield if your soil phosphorus bank is low. The application of 60 lb./A of MicroEssentials S-10 (12-40-0-10S) will provide 24 lb./A P205 which is around the same level as crop removal for a 40 bu./A durum crop. Canola, lentils and peas will remove about the same amount at this yield. If your soil tests are low to very low, Agvise recommendations are to apply 72 to 85 lb./A S-10 in durum or wheat, and are even higher for field pea or canola. Because only limited amounts of fertilizer can be safely applied with the seed, it is important to prevent fields from falling into very low soil test levels.
Chloride
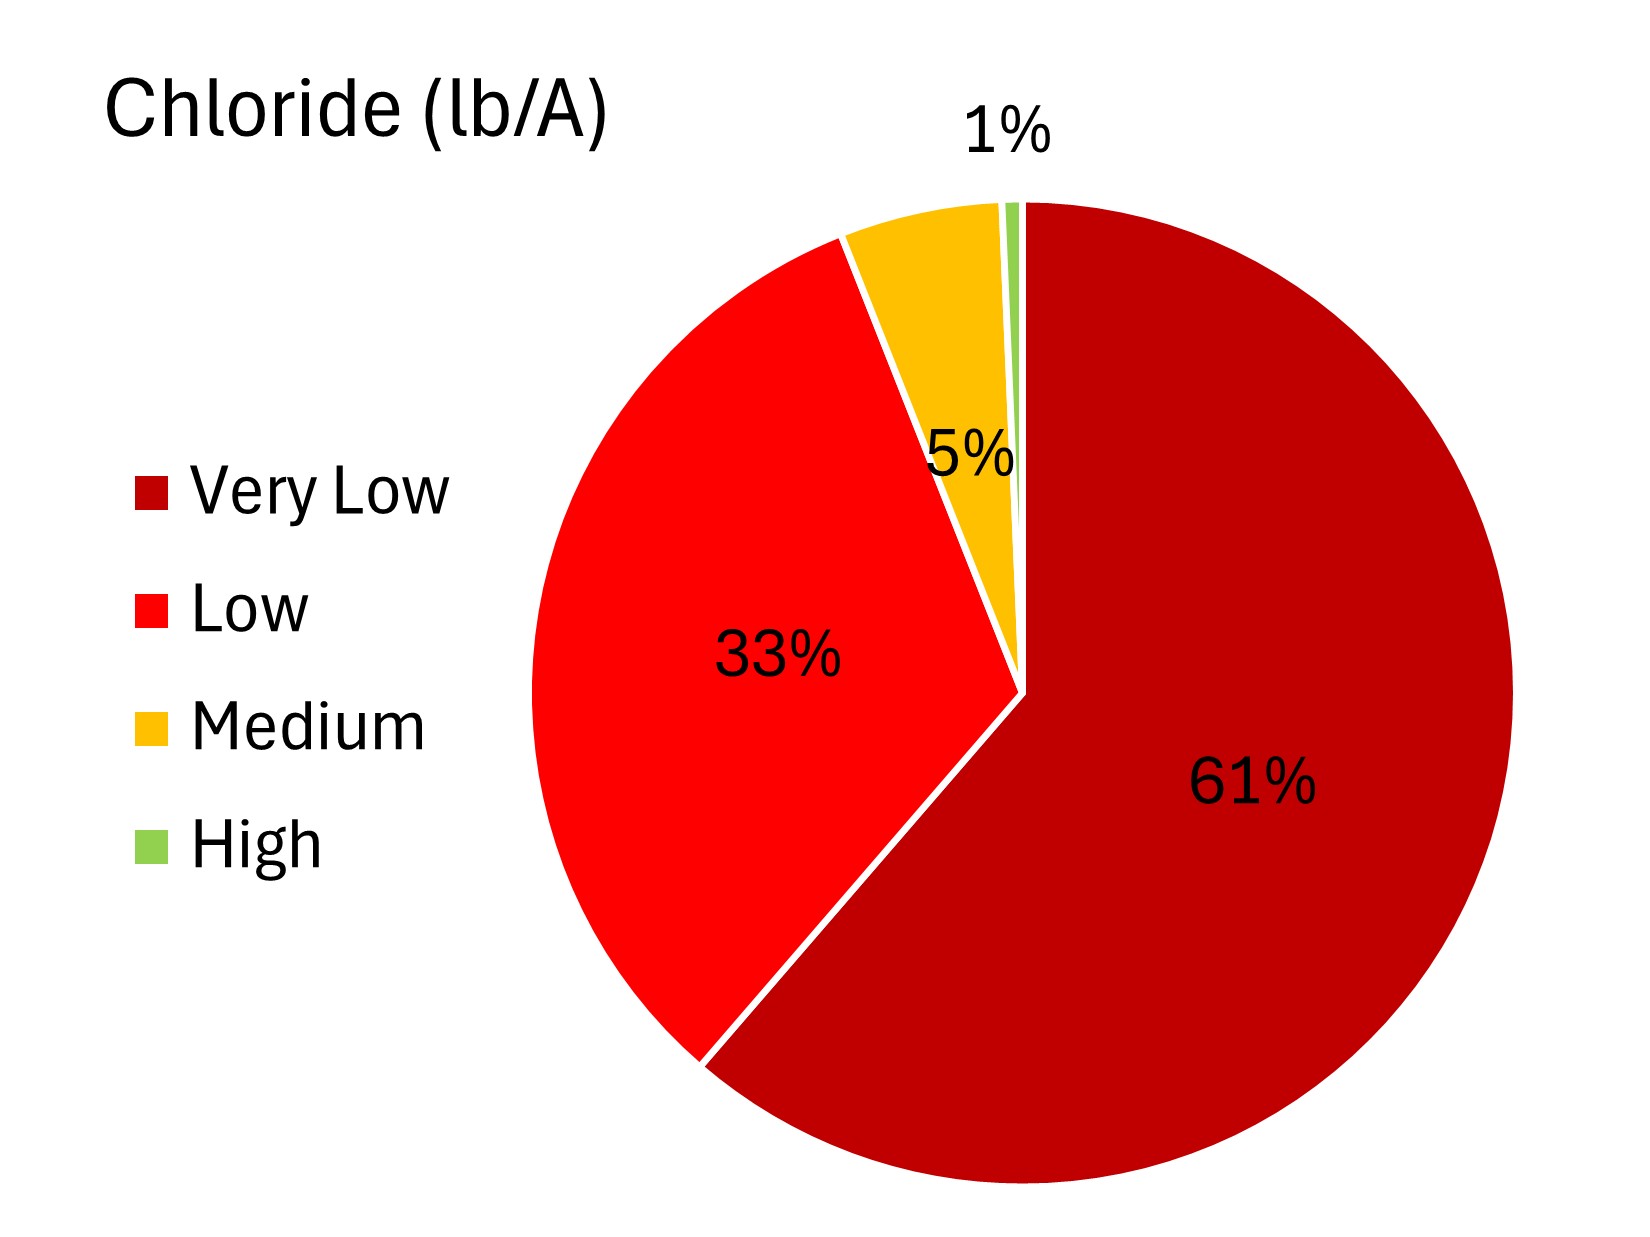
Chloride is an essential micronutrient for plants and plays an important role in crop water use efficiency, photosynthesis, nitrogen use efficiency and disease resistance. Chloride deficiency has been associated with leaf spotting symptoms, stunting, decreased grain size and yield losses in durum. Chloride is mobile in the soil, so where it is deficient it should be applied to wheat and durum on an annual basis as potash.Almost all of the fields we tested were in the low to very low category for chloride. Wheat yield increases of 2-5 bu./A on average have been documented in fields below 40 lb/A (medium, low and very low). With so many fields in the low and very low category the likelihood of a yield response seems high.
If you want to discuss your 2026 fertility plan, or are new to soil testing and want to get started feel free to reach out. We dedicate a large portion of our time in the fall to soil testing, so planning ahead helps ensure that it all gets done.
Dr. Audrey Kalil,
Agronomist/Outreach Coordinator
Sara Erickson
Agronomist, Williston Location
Julia Seiller
Agronomist, Fairview Location
2025 Zone Soil Testing Report
Variable rate fertilizer application adjusts fertilizer rates across a field based on how different areas typically perform. Low productivity areas won’t yield as much as high productivity areas, so fertilizer is reduced in those spots to better match inputs to yield potential. These areas, or zones, can be identified using satellite NDVI imagery. NDVI stands for Normalized Difference Vegetation Index, and it uses red and near infrared wavelengths of light to measure vegetation density and crop health (greenness). By reviewing satellite imagery from multiple growing seasons we can build a zone map for your field. This map guides soil sample collection from high, medium, and low productivity areas which are submitted separately for soil testing. The soil test results then guide the generation of a prescription map.Most of the 55 fields that we zone sampled this fall have been managed using prescription fertilizer applications for several seasons. It is likely for that reason some nutrients did not differ by zone including nitrogen, phosphorous, and chloride.
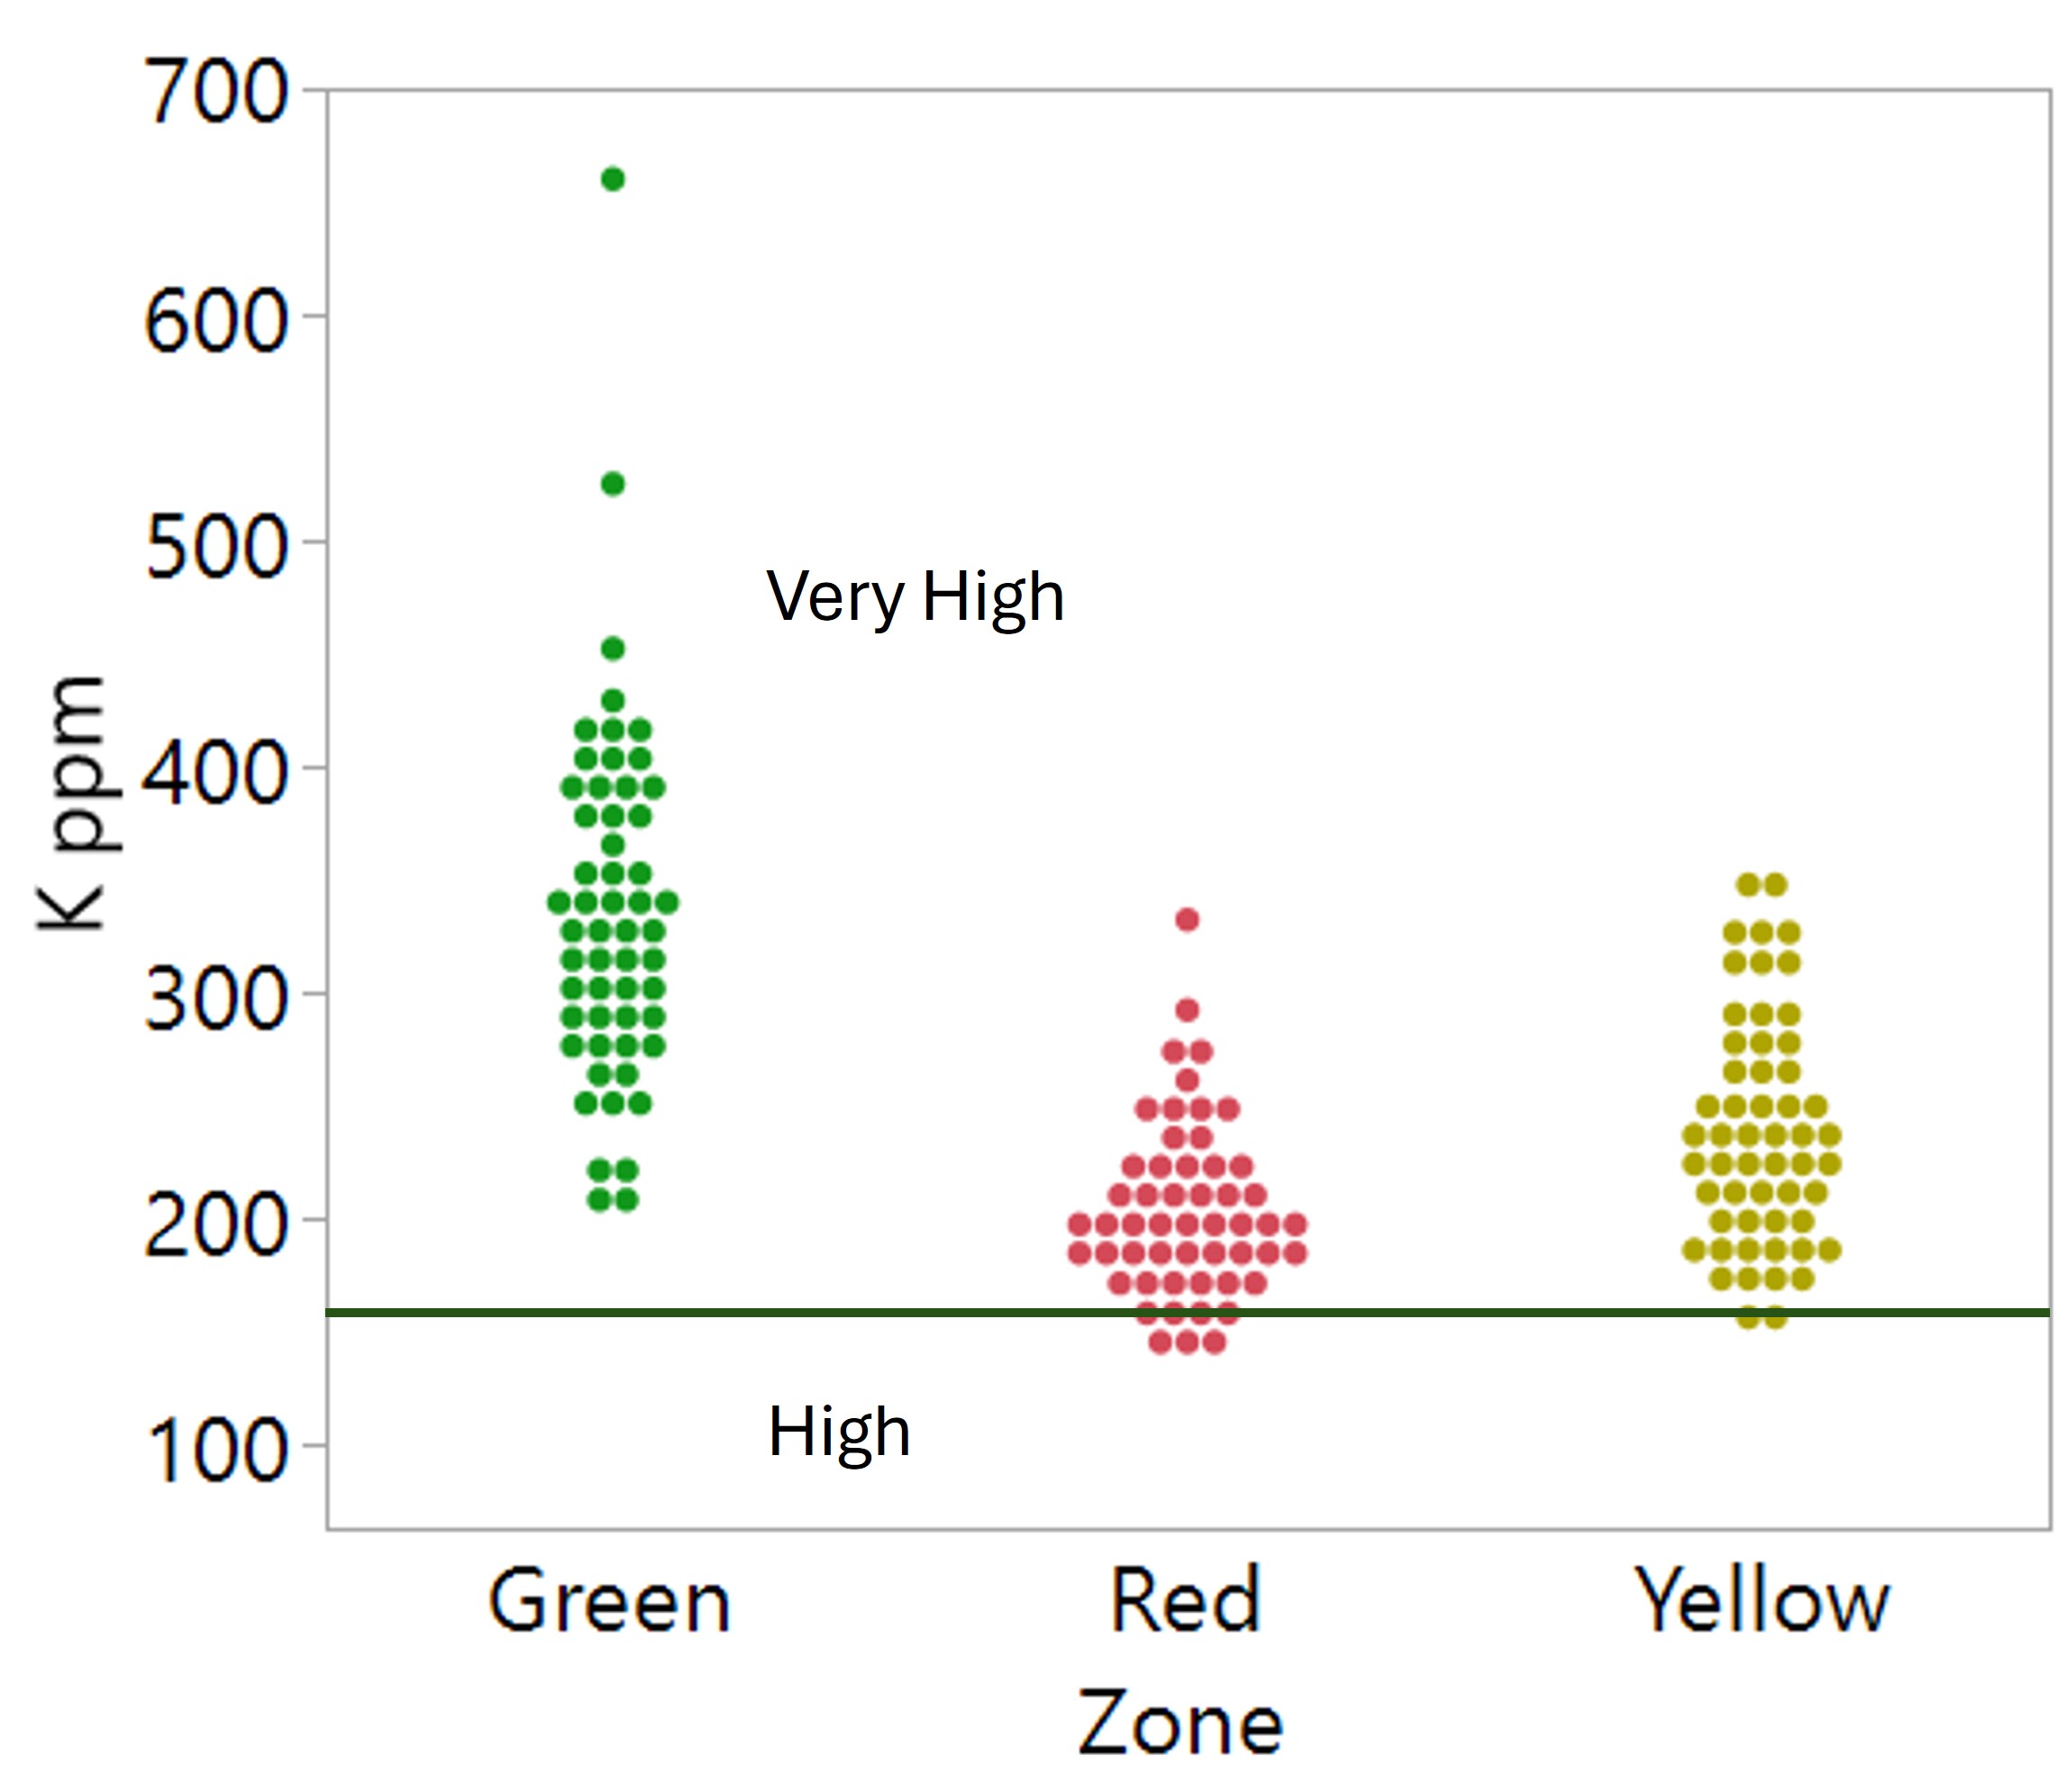
Potassium tended to be higher on average by around 100 ppm in the green zones compared to the yellow and red. Overall, potassium levels were high to very high regardless of zone. On the graph below, the green horizontal line is the threshold dividing the high from very high categories. Each dot on the graph is a zone within a field. Continued monitoring of the yellow and red zones will be important to prevent the development of potassium deficiency over time.
Zinc is an important nutrient for flax production, and with the number of acres planned for flax production in 2026 it is something you might want to pay attention to. NDSU recommends applying zinc to flax fields when soil tests fall below 1 ppm. As you can see from the graph below, the majority of the fields tested fell into this category regardless of zone.

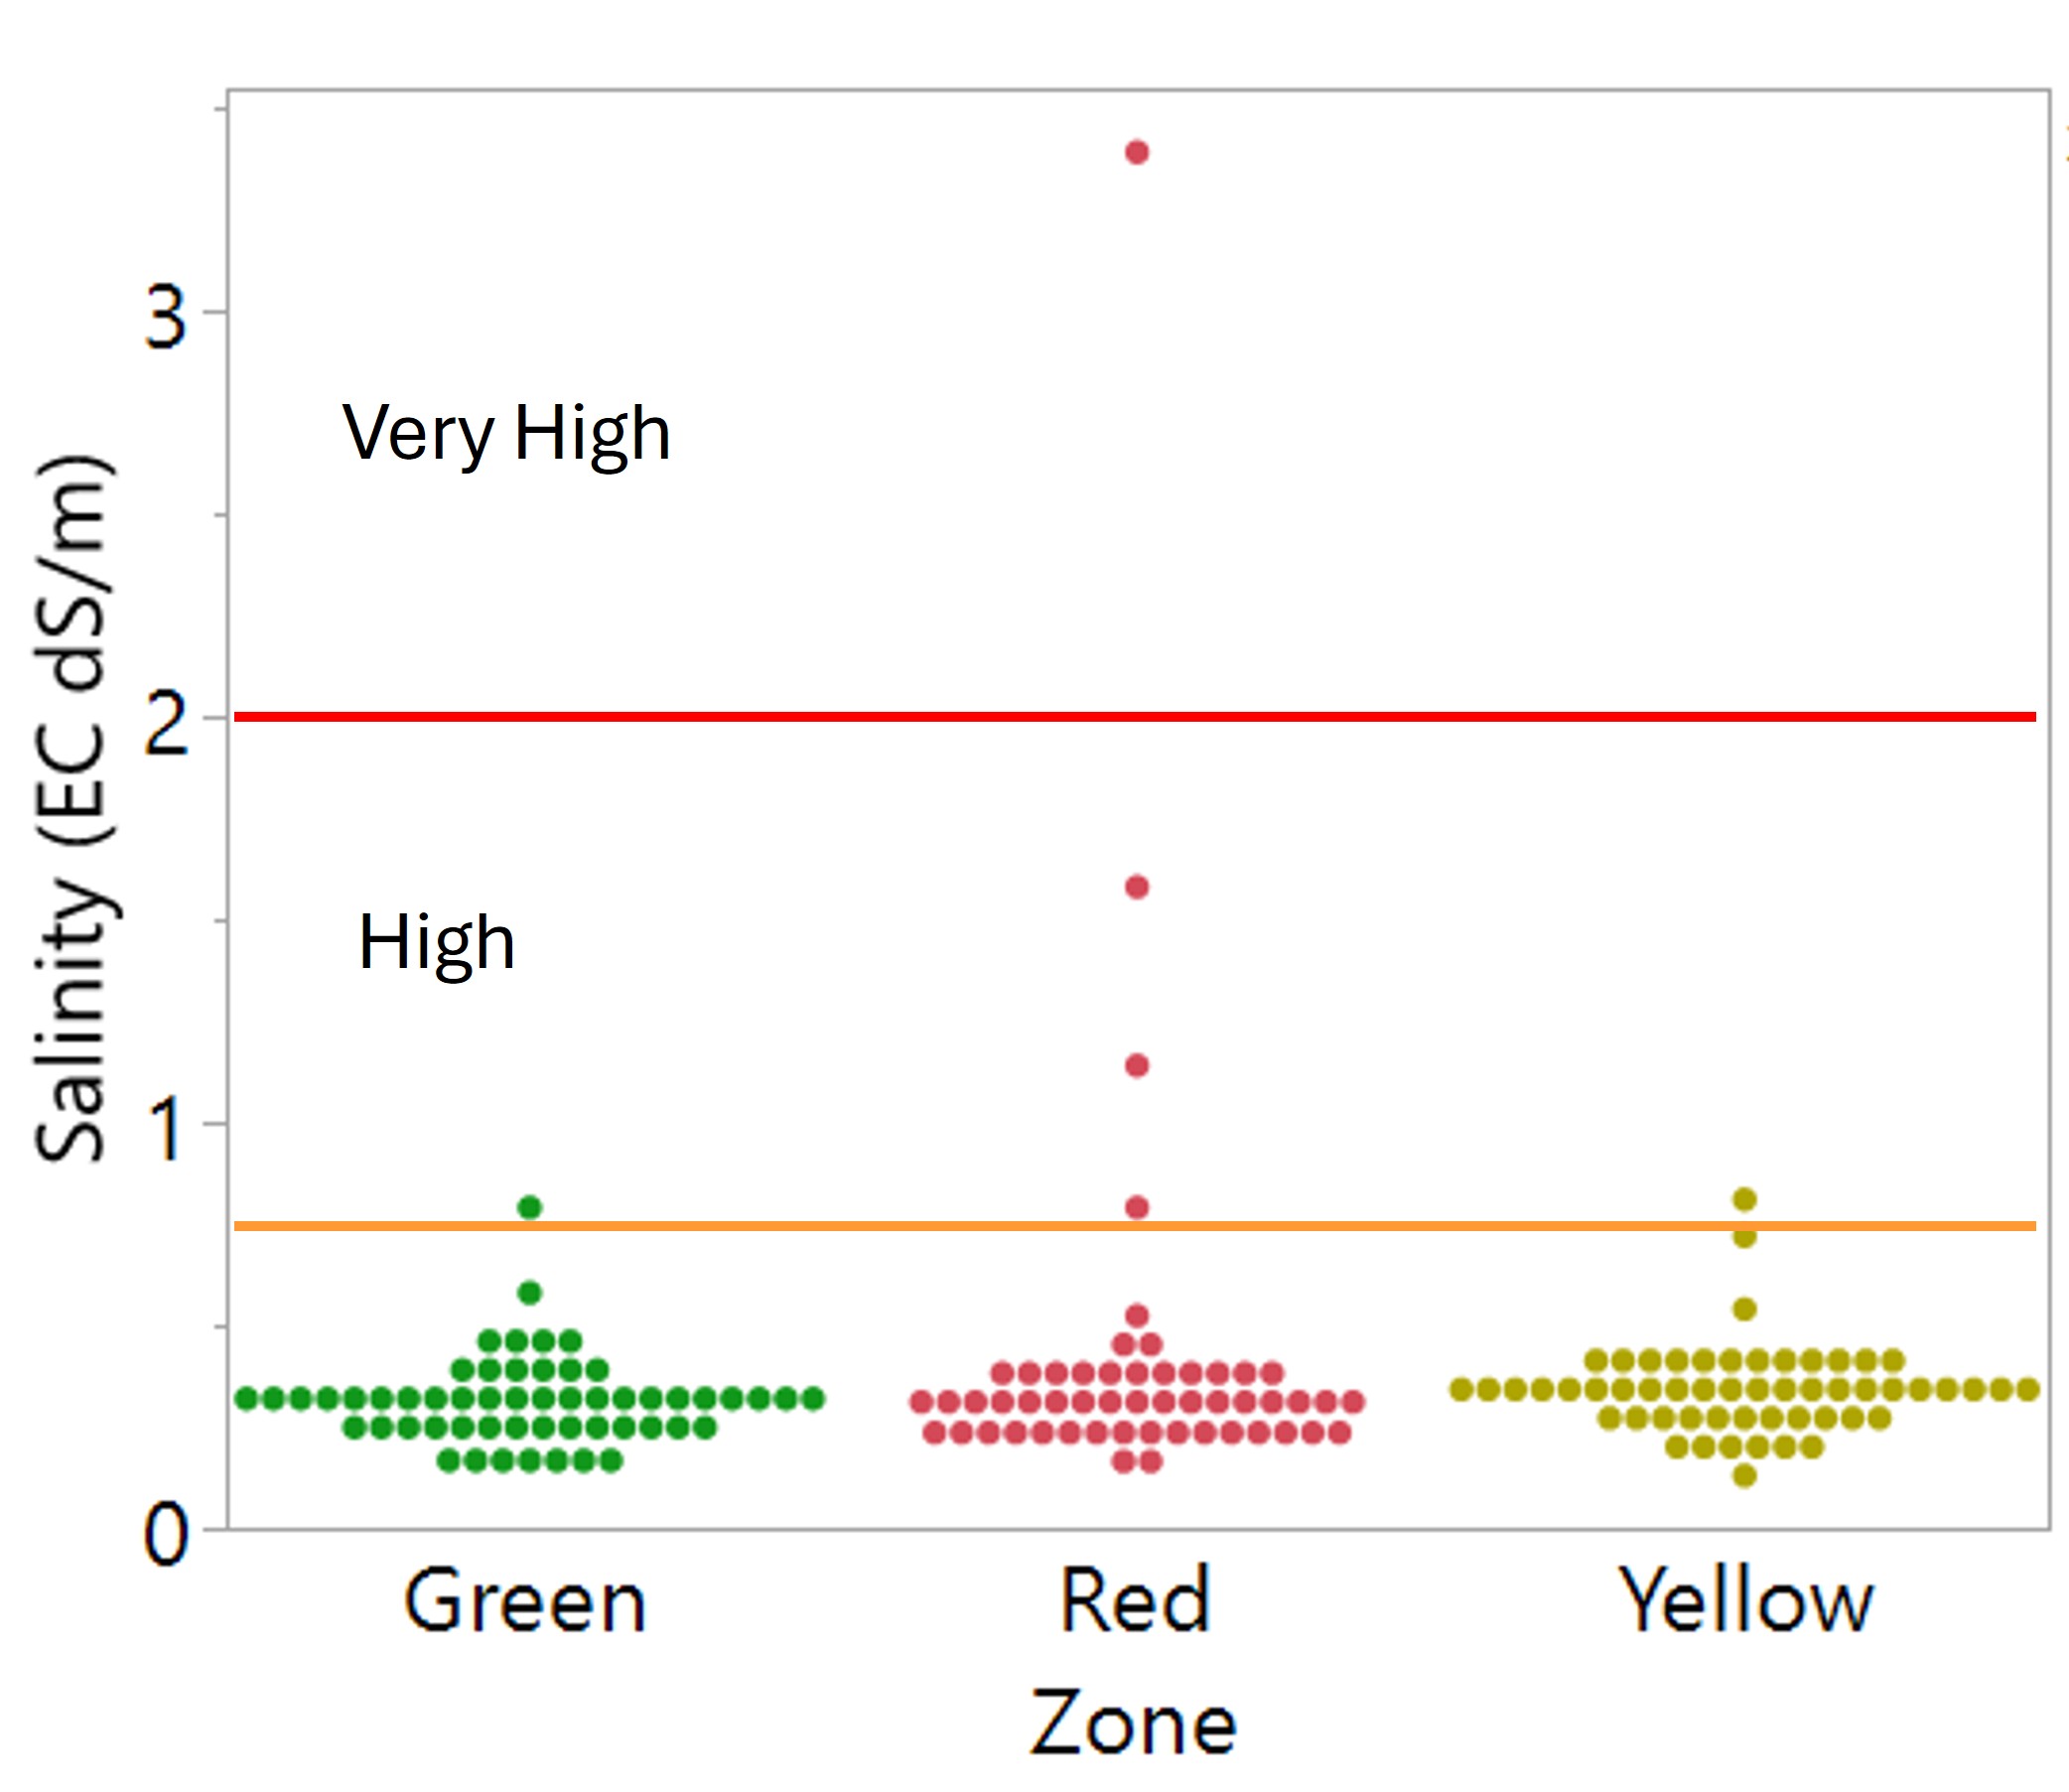
Some zones exhibited high to very high levels of salinity. Most of the time this was associated with a red zone, but not always. These salty areas of the field can be kochia breeding grounds, which then proceed to spread herbicide resistant weeds to the better producing areas of your field and even across the farm. Planting these areas to a perennial salt tolerant grass, or even mowing the smaller patches to prevent kochia seed production might be a better investment of your time and money than planting and fertilizing something that isn’t going to grow.
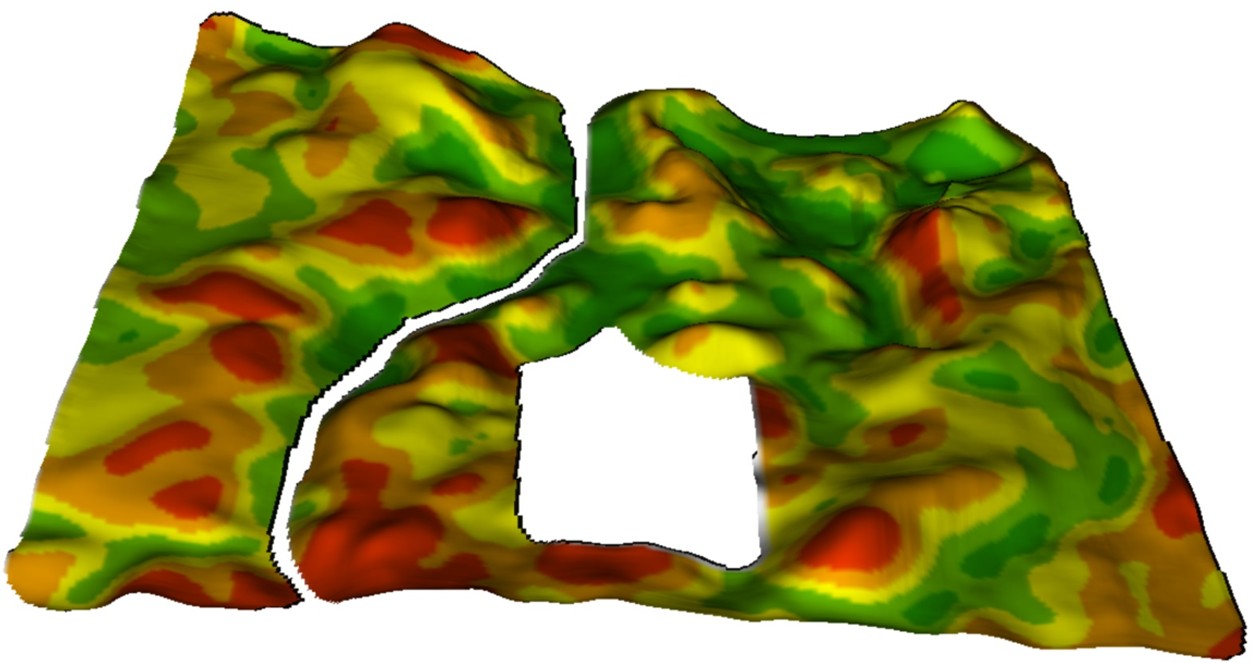
Organic matter was highest in the green areas, followed by yellow and then red. Many red areas correspond with hill tops, and the reduced organic matter is likely a result of erosion (image below). Given the role organic matter plays in water holding capacity and nutrient cycling, this probably a contributing factor for reduced yield in the yellow/red areas.

Fertilizing based on prescription maps and zone soil testing is not yet a widespread practice in our region. As adoption increases, we will gain a better understanding of how soil characteristics influence productivity within individual fields. While zone sampling and prescription map development require additional time, effort, and cost, the approach allows inputs to be allocated more efficiently. By investing fewer resources in low-yielding areas and more in high-production zones, you will ultimately improve agronomic and economic outcomes.
Sara Erickson
Agronomist, Williston Location
Dr. Audrey Kalil,
Agronomist/Outreach Coordinator
2025 Soil Test Summary for Irrigated Fields
We received soil test results from 176 irrigated fields this fall. When compared with results from the dryland fields there were some notable differences, highlighting the variability in soil characteristics and crop nutrients geographically and under different management practices. While the regional summaries from Agvise can help identify overall trends, there is no substitute for sampling on your farm.Nitrogen
Unlike the dryland fields, there were many irrigated fields that had high (61-80 lb/A) to very high (> 80 lb/A) levels of nitrogen left in the top two feet of the soil. Soil testing post-harvest can help you dial in crop nutrition and prevent under or over application of nutrients.High residual nitrogen levels can result from several factors, including mineralization of organic matter and crop residue, as well as poor crop growth that limited fertilizer uptake. While not all of this nitrogen will be available to the next crop due to ongoing nitrogen cycling and potential losses, residual nitrogen can reduce fertilizer costs in the following season. Alternatively, planting winter crops or cover crops can help capture excess nitrogen and reduce losses. Be cautious when planting nitrogen-fixing crops such as soybean into fields with high residual nitrate, as elevated nitrate levels can inhibit nodulation and exacerbate iron deficiency chlorosis (IDC).
Phosphorous
Forty-three percent of irrigated fields tested had high to very high phosphorus levels (12–15 ppm or greater), a larger proportion than observed in dryland fields. However, many fields still tested in crop-responsive ranges (low to moderate).Even in high-testing fields, crops such as wheat and corn can benefit from the “starter effect” when phosphorus is placed near the seed. Elevated soil phosphorus can inhibit zinc uptake, which is why chelated zinc is commonly included in starter fertilizer programs for
corn. While soybean requires phosphorus, research indicates limited benefit from starter fertilizer when soil test levels are already high.

Potassium
Most soils tested had sufficient potassium levels for crop growth, but continued monitoring of this essential nutrient remains important. Five percent of fields fell into the medium category, where a yield response to potassium application is likely.Corn has relatively high potassium requirements, and potash applications are recommended when soil test levels fall below 150–200 ppm, depending on soil type. Approximately one-third of the fields fell into this responsive range (yellow box on graph - each bar is a field). Wheat is responsive to potassium when soil test levels fall below 100–150 ppm (brown box on graph).

Zinc
Corn has high zinc requirements and will show a consistent yield response to zinc when soil tests are low, corresponding to 51% of fields tested. Dry bean is also likely to respond to zinc application in these conditions. High soil pH reduces the availability of zinc as it binds tightly to the soil. Given that all fields tested fell into the high or very high pH category, crops might still be responsive to chelated zinc fertilizers or foliar zinc application when soil test levels are high.
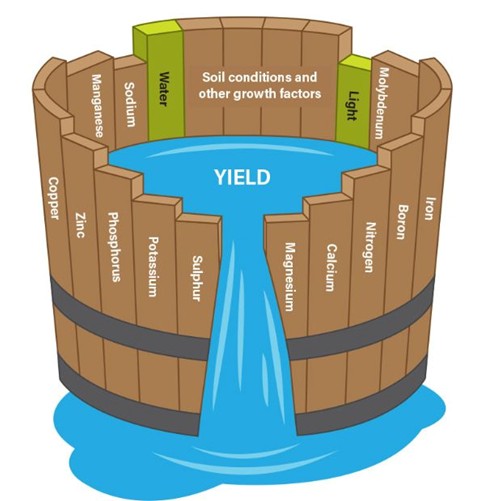
As with all nutrients, yield response to zinc will be limited if other macro- or micronutrients are deficient. The commonly used bucket diagram illustrates this concept: yield potential is limited by the most deficient nutrient, even when others are adequate. Maximizing productivity requires addressing all fertility constraints.
Organic Matter
Most of the fields tested had low (1.6-3%) to very low (< 1.5) levels of organic matter. According to MSU, prairie soils of the Northern Great Plains had at least 4% organic matter. Practices that can build organic matter include reducing tillage, leaving more crop residue in the field, planting cover crops and including perennial crops in the rotation. Higher organic matter levels are associated with increased soil available nutrients and improved water management through enhanced water holding capacity and infiltration.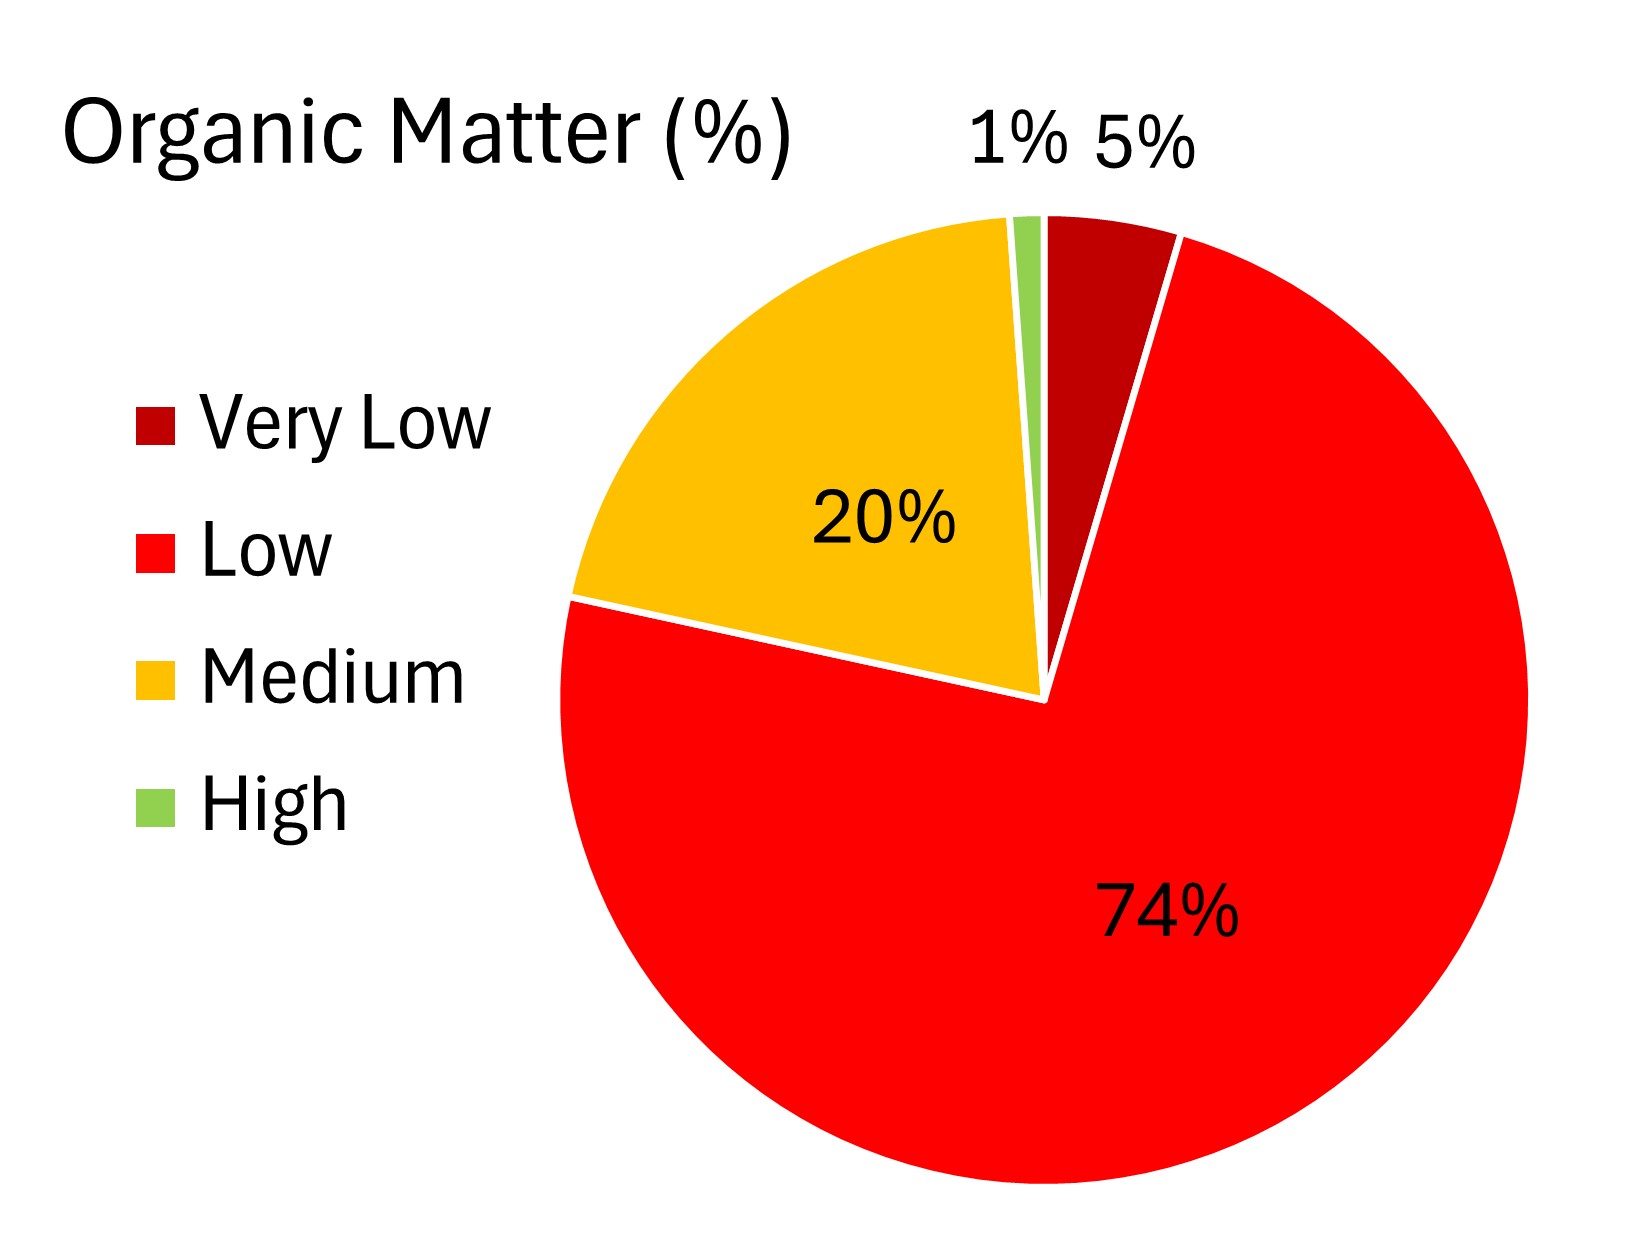
pH
Iron, zinc and boron availability declines when soil pH is above 8 and 93% of fields fell into this category. As you are likely aware, soybean is very sensitive to iron deficiency and this results in iron deficiency chlorosis (IDC). The best way to manage this issue is to plant IDC tolerant varieties. This information can be found in the North Dakota Soybean Variety Trial Results and Variety Selection Guide.Nitrogen fertilization in no-till systems has been found to acidify the top few inches of the soil, so perhaps the adoption of no-till to preserve organic matter could have the additional benefit of reducing soil pH.

Overall, 2025 irrigated soil test results show wide variability in NPK levels, widespread zinc deficiency, low organic matter; and predominantly high soil pH. These findings reinforce the importance of field-specific soil testing and customized fertility plans to address the unique conditions of each field and maximize crop productivity.
Dr. Audrey Kalil
Agronomist/Outreach Coordinator
Julia Seiller
Agronomist, Fairview Location
Kyle Okke, CCA
Agile Agronomy LLC & Agronomists Happy Hour podcast